Challenge
Urban heat is rarely distributed evenly. The project asked how satellite heat signals, tree canopy, income, age, and transit access could be combined without flattening neighborhood realities into a single abstract score.
Spatial analysis of urban heat and infrastructure inequality using remote sensing and census data.
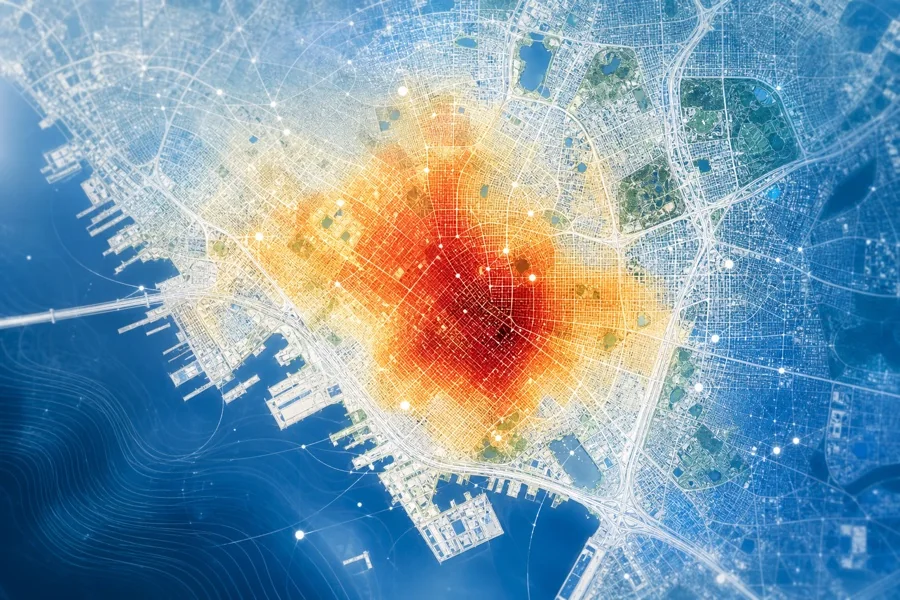
Urban heat is rarely distributed evenly. The project asked how satellite heat signals, tree canopy, income, age, and transit access could be combined without flattening neighborhood realities into a single abstract score.
I cleaned census variables, joined them with land-surface temperature rasters, and designed a readable map layer that compared heat exposure with adaptive capacity. The analysis emphasized explainable variables so findings could travel from a lab notebook to a civic conversation.
The final brief identified priority neighborhoods where cooling infrastructure, shade, and public communication would create the greatest benefit. It also documented uncertainty so the map could support decisions without overstating precision.